3 row-level formulas to level up your Salesforce reports
Need to bucket an SFDC field based on the calculated value of that field and another? The row-level formula is your friend. Learn more by reading: "Everything Starts Out Looking Like a Toy" #202
Hi, I’m Greg 👋! I write weekly product essays, including system “handshakes”, the expectations for workflow, and the jobs to be done for data. What is Data Operations? was the first post in the series.
This week’s toy: a hardware camera about the size of an AirPods case with no wifi, Bluetooth, or other kind of connectivity besides USB-c that takes 50,000 pictures on a single charge. If you’re looking to create time lapses of … well, anything, this might be your new favorite toy. Edition 202 of this newsletter is here - it’s June 10, 2024.
If you have a comment or are interested in sponsoring, hit reply.
The Big Idea
A short long-form essay about data things
⚙️ 3 row-level formulas to level up your Salesforce reports
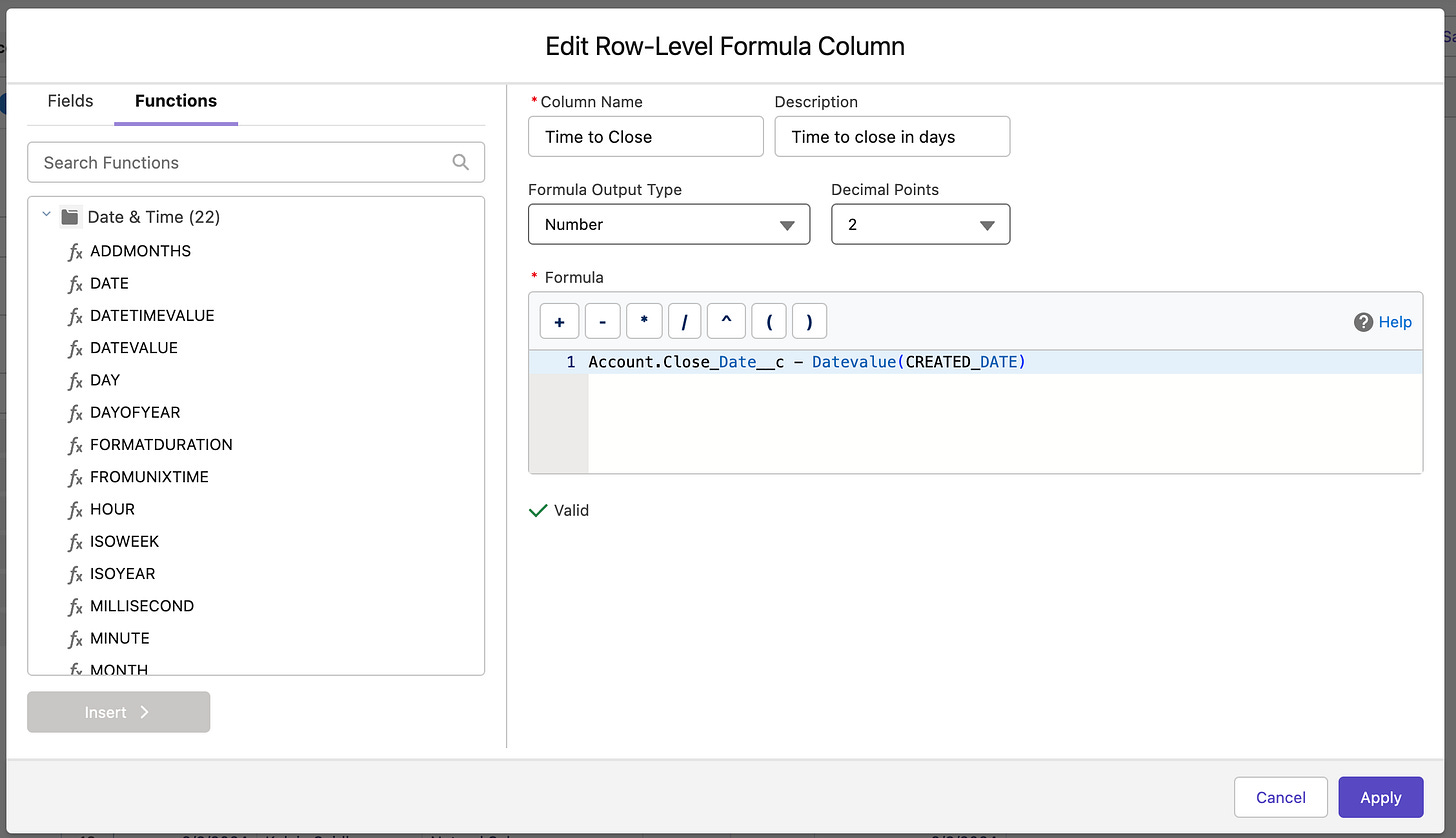
Reports in Salesforce are easy to build, easier to filter, and really annoying to update if you want to create arbitrary groupings of accounts or contacts. One trick that helps improve almost any Salesforce report is the row-level formula, a special kind of Salesforce formula field that uses other existing fields in the report to create its logic.
Salesforce describes it as a calculation that takes place on every row of the report. Because it’s a temporary calculation that happens outside of the data model, row-level formulas are pretty flexible and don’t require changes to the underlying objects.
There’s one important thing to remember. Reports may contain only a single row level formula in each report, so make it count.
Why use row-level formulas?
Row-level formulas let you display a value that’s not in your data model for data analysis. This makes it possible for you to iterate quickly instead of creating custom fields that are essentially one-time use fields.
With Row-level formulas, you create logic that makes it easier for you to build semi-custom reports without building a custom report type.
What can you do with a row-level formula?
Here are a few ideas for you to try in your Salesforce reports. They are grouped into three types of formulas:
Ratio calculations - these divide one field by another or create complicated averaging or max field values that are not limited to a single field
Date difference - compare two date or date time fields and perform a date calculation
Multiple field comparison - use a combination of tests against multiple fields to create a temporary segment
Each of these strategies lets you solve a different problem, though you can combine them to create more complex solutions.
Don’t forget - you only get one row-level formula per report, so be mindful of when you want to use it directly and when you want to use it to drive the logic of other existing fields.
Examples of field level formulas as ratios
Salesforce makes it easy to get an SUM, AVERAGE, MEDIAN, MIN, and MAX field for a number value. But what if you wanted to get a ratio based on another field, such as “MRR/User”? If you have a mrr_c field and num_users__c field on your account, it’s as simple as using the calculation mrr_c / num_users__c to get the value.
Perhaps you want to extend on this idea to segment your accounts based on this ratio. You could use the formula to bucket these based on the ratio into a value that would sort nicely:
SWITCH(
TRUE,
MRR__c / num_users__c > 500, "1 - Best",
MRR__c / num_users__c > 250, "2 - Good",
MRR__c / num_users__c > 100, "3 - Ok",
"4 - Low Value" )
It’s true you could use a similar method for a bucket field to sort these accounts, but you’d need an extra formula field to calculate the ratio before grouping the accounts, making row-level formula fields an excellent first step to determining the shape of data in Salesforce reports.
Using a date difference to drive urgency
Another typical way to use row-level formulas in Salesforce reports is to call attention to accounts that need attention.
For example, you might want to determine the number of days since the last updated value, like the number of days since an account was qualified:
TODAY() - Account.MQL_Date__c
Or you want to know if an account has had any updates in the last 30 days:
IF(LAST_N_DAYS:30 > MAX(ActivityDate__c, NULL), "No Recent Activity", "Active")
Once you have this value, you can also use filters in the report to show records that need attention, e.g. when using the formula above, accounts with “no recent activity”.
Another common use for this date difference is to calculate mid sales cycle differences when you date stamp your accounts or opportunities, e.g. days from stage 1 to stage 2.
Multiple Field Comparison in Row-Level Formulas
Finally, a technique that gives you the utmost flexibility is to use a row-level formula in Salesforce for text manipulation. Use this tactic to find the directory in a first visit attribution URL; to extract an ID from a URL, or to perform a kind of fuzzy match on a string.
This is a complex comparison that goes beyond a bucket-field grouping and lets you run custom rules based on the value of several different fields. You can use this to drive a simple account score that aggregates information, or simply use it to create a true/false switch in your report for other grouping.
Another technique that works in many BI tools, but not in Salesforce
Here’s a bonus technique that would be great if it worked better in Salesforce. You can combine text fields to create a dynamic url to cut and paste into a browser, but HYPERLINK(“link”, “link name”)fails to work to create a clickable URL from a report, even though Salesforce will recognize it as valid syntax. (I guess you’ll have to use a URL formula field on the regular object layout for that one.)
What’s the takeaway? Row-level formulas are a useful tool in the Salesforce reporting toolkit. They make it possible to calculate ratios and scores or to bucket records based on multiple field comparisons, making them more versatile than standard SFDC reporting.
Links for Reading and Sharing
These are links that caught my 👀
1/ Sketchy components - I’m a fan of computer elements that look like they’re hand-drawn. This is particularly useful when you’re designing prototypes of new features, want to iterate quickly, and don’t want the finished product to look too polished. Enter Wired JS, a library to help you do just that. It makes it much easier to demonstrate designs without spending lots of time to draw them by hand, while keeping a hand-drawn feel.
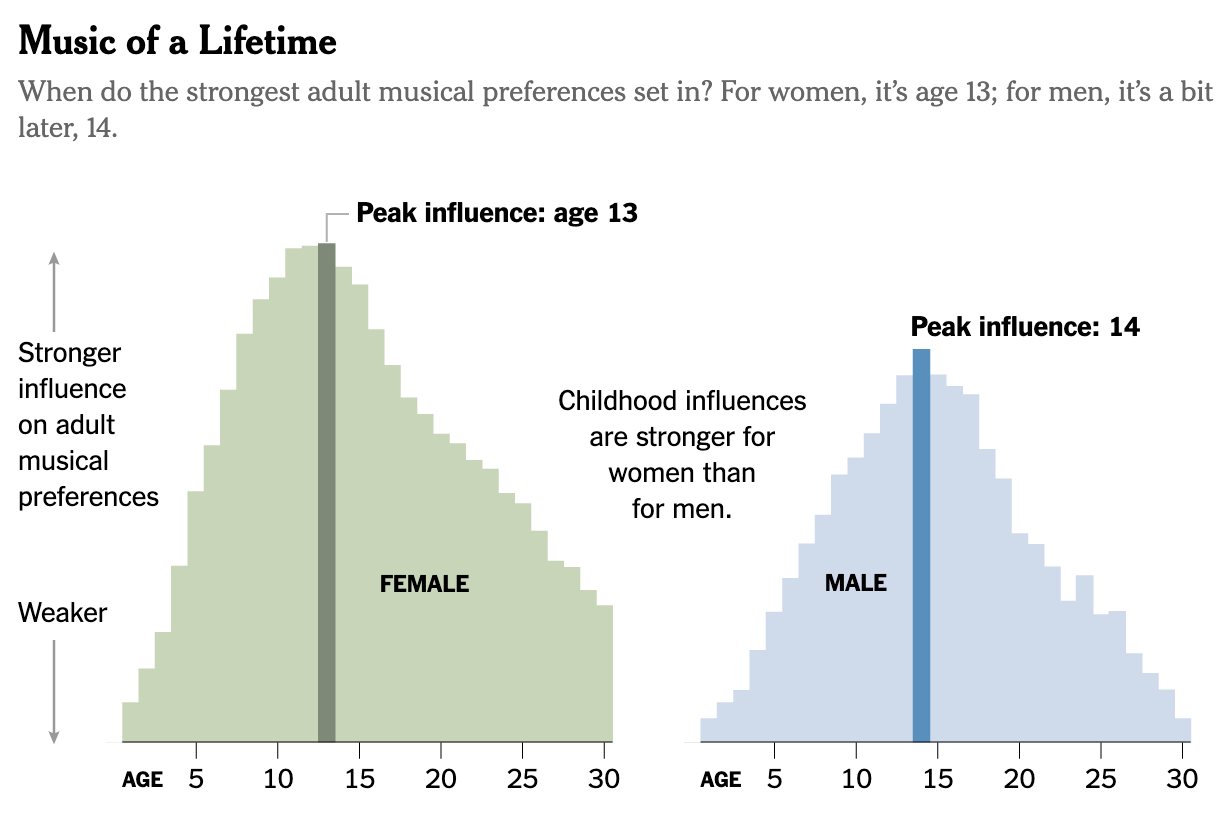
2/ You’re listening to middle school music - It’s true. Most people’s taste in music is rooted in what they listened to during late middle school.
A research team has validated this effect, so the next time your Spotify playlist adds a banger from early high school, don’t blame AI.
3/ Sheperd Tone - You might have noticed something about the background music in the scores of Christopher Nolan films. There’s a style of audio called a “Sheperd Tone” that very cleverly manipulates your senses by changing pitch in a controlled way. Directors and musicians use this effect to up the tension in a scene with this sound effect.
What to do next
Hit reply if you’ve got links to share, data stories, or want to say hello.
Want to book a discovery call to talk about how we can work together?
The next big thing always starts out being dismissed as a “toy.” - Chris Dixon


