

How do you show your work with LLMs?
To gain credibility for your science project, you need more than a prompt. You need a reproducible blueprint. Read: "Everything Starts Out Looking Like a Toy" #277

Hi, I’m Greg 👋! I write weekly product essays, including system “handshakes”, the expectations for workflow, and the jobs to be done for data. What is Data Operations? was the first post in the series.
This week’s toy: a plan for a data center … in space? I feel like I’ve seen a movie about this before, and it didn’t end well.
Edition 277 of this newsletter is here - it’s November 17, 2025.
Thanks for reading! Let me know if there’s a topic you’d like me to cover.
The Big Idea
A short long-form essay about data things
⚙️ How do you show your work with LLMs?
Chatbot outputs sometime seem like magic. The first time you feed a PDF to Google’s Notebook LLM tool and get a podcast that explains the document to you, it feels like magic. The second time you do the same thing, you realize the response looks a bit the same. It’s too much to say that every response is identical, but not surprising to imply that AI responses rhyme.
So when you bring a magic trick to your team where you collaborated with Claude to categorize a dataset, or pulled insights out of noisy text, or cleaned up product feedback, the natural response for the reader is to be a tiny bit skeptical.
The content looks great, and then you find some out-of-context weirdness that’s completely normal for AI when it spits out tokens but out of character for a human who did that analysis. And then the real questions start:
“How confident are you… and why?”
“Where’s the data so I can look at it myself?”
“If we needed to do this again at scale, how would we reproduce it?”
If you don’t have an answer to show your work, that’s where the project runs into a brick wall. It makes sense, because there’s no clear path for another person (especially analytics) to retrace what happened and repeat your non-deterministic output (thanks AI) in a deterministic way.
Your teammates want to know:
“Show me the steps so I can trust the result — and ideally automate it later.”
Bridging the trust gap
When someone gives a demo and acknowledges they used AI to build it, there’s a silent undercurrent going on.
What exactly did you give the model?
What instructions did you use?
What did you throw away?
What did you fix manually?
How do I know this wasn’t a lucky run?
How would we scale this beyond one-off prompting?
Your teammates are asking for the instruction set because they’re not sure it will be repeatable. If that methodology only exists in your head, then you’ve created something useful, but not reproducible.
To turn your idea into a data factory, you need to be able to test it on new data, check edge cases, measure consistency, and eventually automate it so that it moves from your laptop to an automated job running on a server.
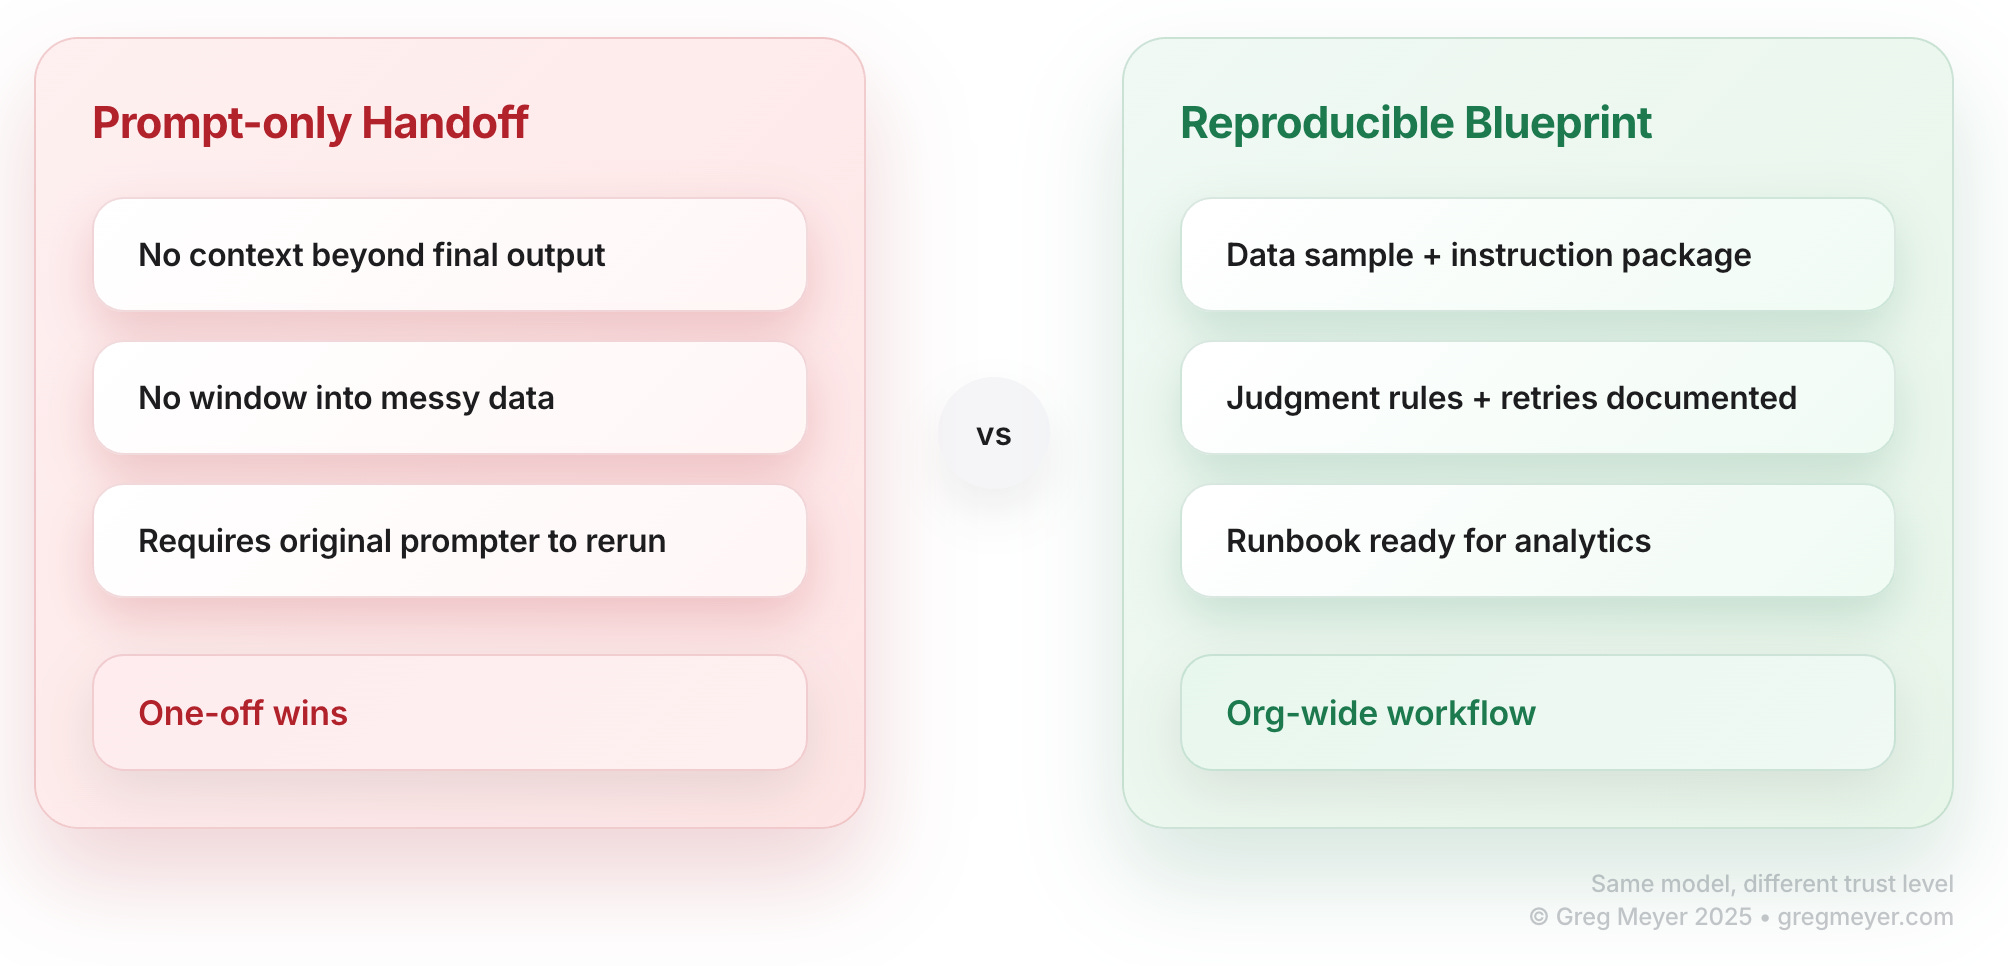
A prompt isn’t a blueprint
It’s tempting to share a raw prompt and say “try this out”. But a reproducible template has a few more items to be solved. Analytics teams need the whole shape of what happened.
Here’s a kit to turn your idea into a factory.
1. A representative data sample
Describe the data you’re using to start your process. At the bare minimum, you need a csv file with some columns and data, including any assumptions you made to clean up the data.
For example, if you’re cleaning a list of company accounts you might start by identifying how you create a single row, and where you’re going to get more. If you’re starting with data from a public source like Google, what are you gathering? A domain name may lead you to other values like a company name, headquarters, employee count, and revenue numbers. But what did you do when you have two companies that have a similar name?
This answers:
“What exactly did the model see, and how dirty was it?”
2. The instructions for an agent
To repeat your experiment, you need to act like an AI agent. When you wake up and need to learn your “job”, where is the agents markdown file that informs your context?
the system message (“act like a classifier…”),
the task instructions,
the examples you gave,
any constraints you added,
any retry steps,
the model settings (which model to use, temperature, etc.).
This defines the logic environment analytics will need to replicate. Essentially, you’re creating a manual Eval that helps other team members to know which items to change when you try to calibrate the output.
3. Your rules for interpretation
Now that you’ve built the basic rules, you need to document your rubric for fine tuning.
It includes:
what counts as a correct or acceptable answer,
what errors you tolerated,
how you resolved uncertain cases,
any manual fixes you made,
how you grouped or merged categories,
how you judged the model’s confidence.
This is the blueprint for turning a one-off judgment into a repeatable process.
4. Building a runbook
All of these hypothetical steps don’t mean much without a clear Standard Operating Procedure or runbook. This is a set of steps that anyone can follow and get the same results you achieved.
Example:
Export dataset from source system
Remove rows with missing or invalid values in key fields
Ask the model to classify each row using the instruction package
If an answer is unclear, re-prompt using a clarification step
Store original input and model output side-by-side
Merge or normalize categories according to your rules
Produce the final dataset and summary for stakeholders
This is the bridge from one-off success to scaled workflow.
5. A small example of outputs
Showing an example of the outputs from your input list gives you a sample that you can use as a tester to demonstrate that you executed the workflow successfully.
typical cases,
edge cases,
the weird stuff,
where the AI struggled,
what you fixed manually.
This is the “truth table” analytics uses to validate the scaled version.
Why does this blueprint matter?
When your team has these artifacts and not just your demo, they can:
reproduce your run,
validate your confidence claim,
test consistency,
automate the pipeline,
wrap it in a UI so the next team doesn’t need to think about prompts,
monitor it for drift.
That’s how AI moves from:
“Cool demo”
to“Reliable workflow the whole org can use.”
What’s the takeaway? If you want your teammates to trust AI-driven analysis
and if you want your analytics team to turn your idea into a scalable tool, you need more than a prompt.
Links for Reading and Sharing
These are links that caught my 👀
1/ Compare AI image models - A couple of years ago, the idea that an AI model could create an image so good you might not be able to distinguish it from a digital image captured by a camera seemed far away. It’s reality now, and LateNiteSoft created a comparison to show you the differences between models.
2/ Leapfrogging the grid - Communities in Africa are electrifying differently. Without a grid to constrain the design, they are creating a solar-first energy system.
3/ Just ship it - Posthog reminds us that shipping beats deliberation. If you believe in the concept of incremental delivery, there’s a limit to the benefits of collaboration before you put the next PR into the world.
What to do next
Hit reply if you’ve got links to share, data stories, or want to say hello.
The next big thing always starts out being dismissed as a “toy.” - Chris Dixon
Love this perspective! The 'magic' of LLMs is so real. What’s the best way to demystify the proces without losing that initial wonder for new users? So insightful!