Long queues might be better than short lines
Do you get better throughput from a longer, careful process or a succession of short cycles that might miss important items? This is "Everything Starts Out Looking Like a Toy" #120

Hi, I’m Greg 👋! I write essays on product development. Some key topics for me are system “handshakes”, the expectations for workflow, and the jobs we expect data to do. This all started when I tried to define What is Data Operations?
This week’s toy: Volkswagen has created an office chair that goes 20kph. Not only does it have lights, chrome, and speedy tendencies: it’s got an awesome sound system to boot so you can have your own office party. Edition 120 of this newsletter is here - it’s November 21, 2022.
The Big Idea
A short long-form essay about data things
⚙️ Long queues might be better than short lines

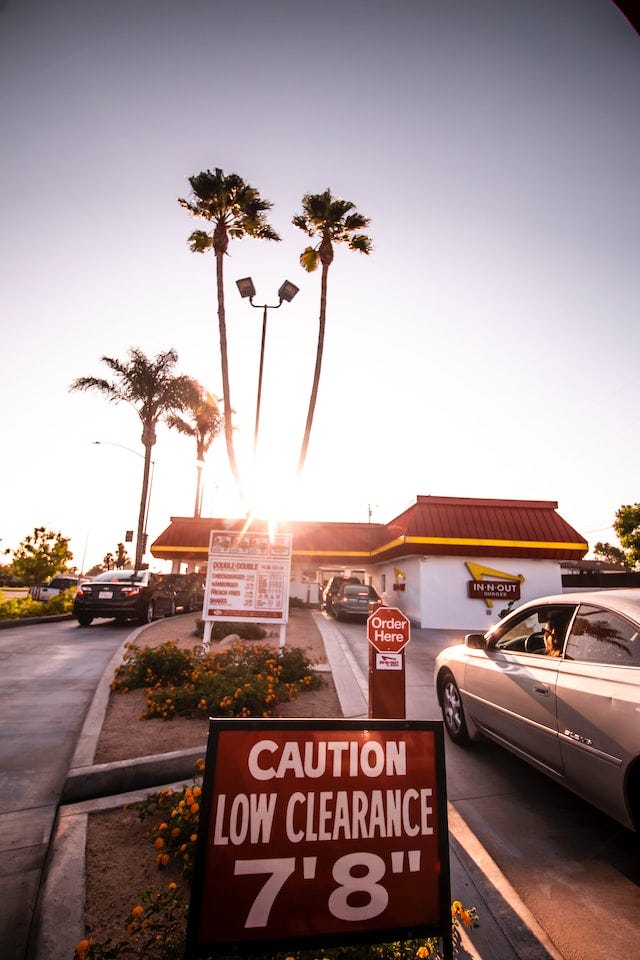
How do you know if a restaurant is popular? One sign is the number of people in line. In the last couple of years, that has looked like a drive-through line, but now that people are coming back to stores there is equal focus on the in-store experience. People arrive at quick service restaurants to get food quickly. They come back because the service and food offerings match in value.
When the line is too long or the experience unknown, people get disgruntled. They might be willing to wait in lines for certain brands (Chick Fil-A, In and Out) because of novelty or uniquess, but eventually every brand has to deal with line balk. This is a fancy way of saying “decided to leave the line due to frustration.”
Why do people give up on lines?
The most obvious reason people give up on lines is that they take too long relative to expectations. What do you expect to see when you go to a fast food restaurant or a coffee shop? Ideally you want to see a line process where people wait for an expected period of time and then get their food. Even more important is the idea of seeing progress. When the line doesn’t move (a complicated order, a register problem involving cash and change or a declined payment method), you don’t know how long it’s going to take.
So is a short line or a long line better for expectations and results? Let’s take a look at two examples of line management in popular restaurants.
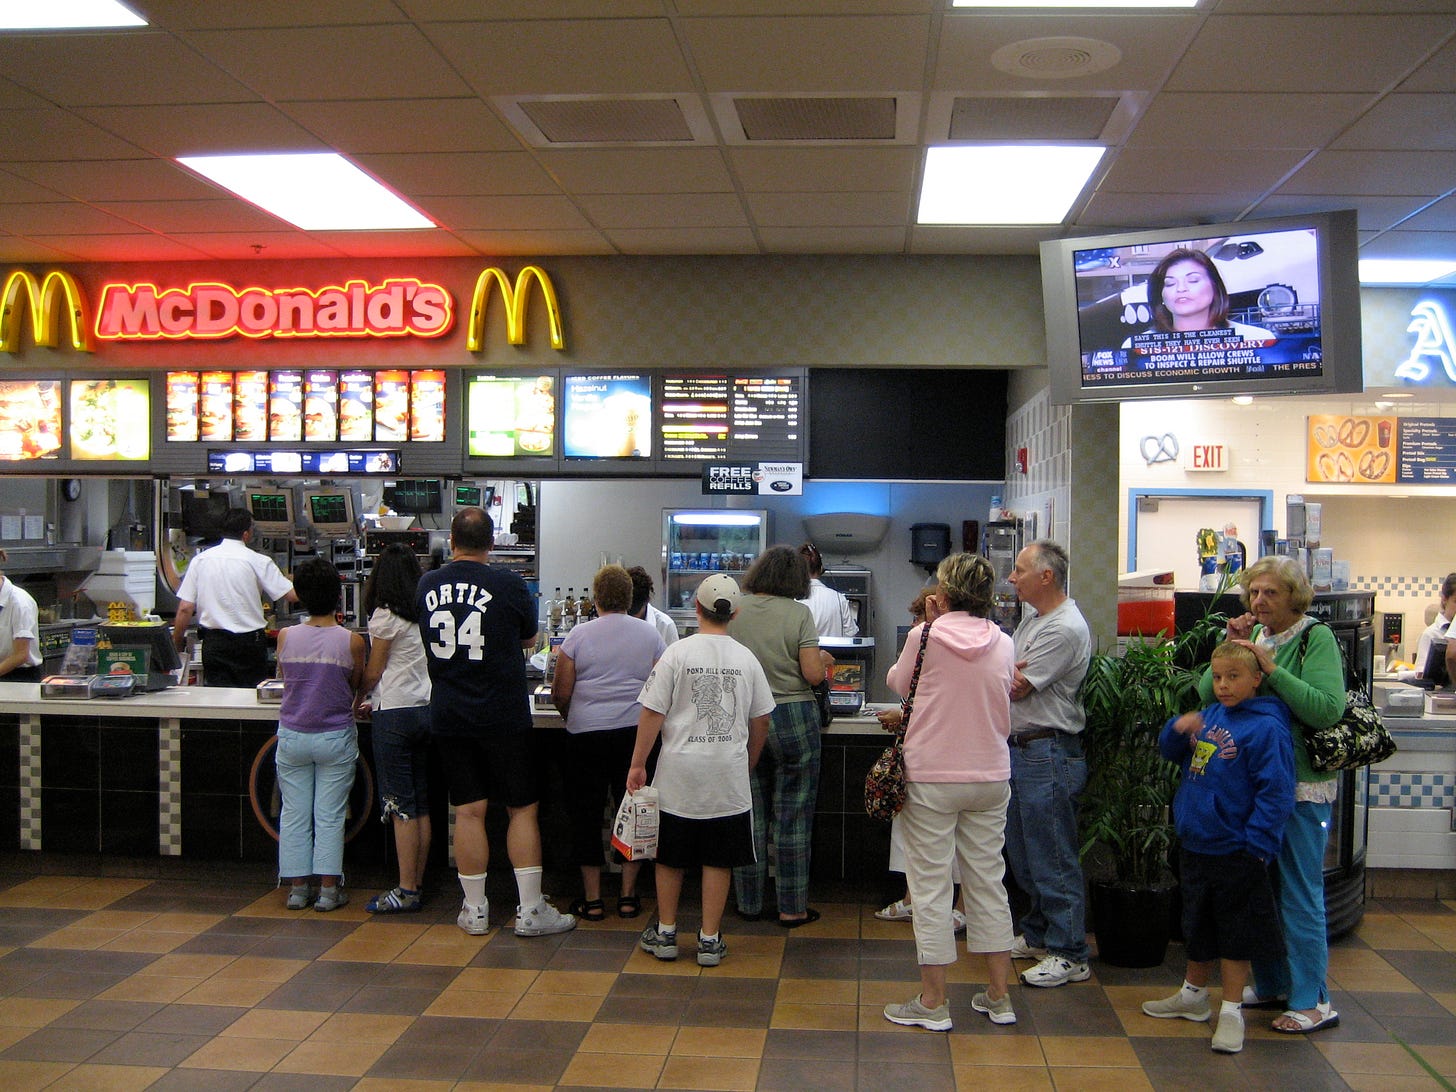
McDonald’s is a burger chain that has a lot of restaurants with many short lines and multiple registers. This creates many short lines at capacity, where additional registers are brought on line to handle variable line sizes. When only one or two registers are being used, McDonald’s has long individual lines in store. When it’s busy, all of the individual lines are short, until they fill up.
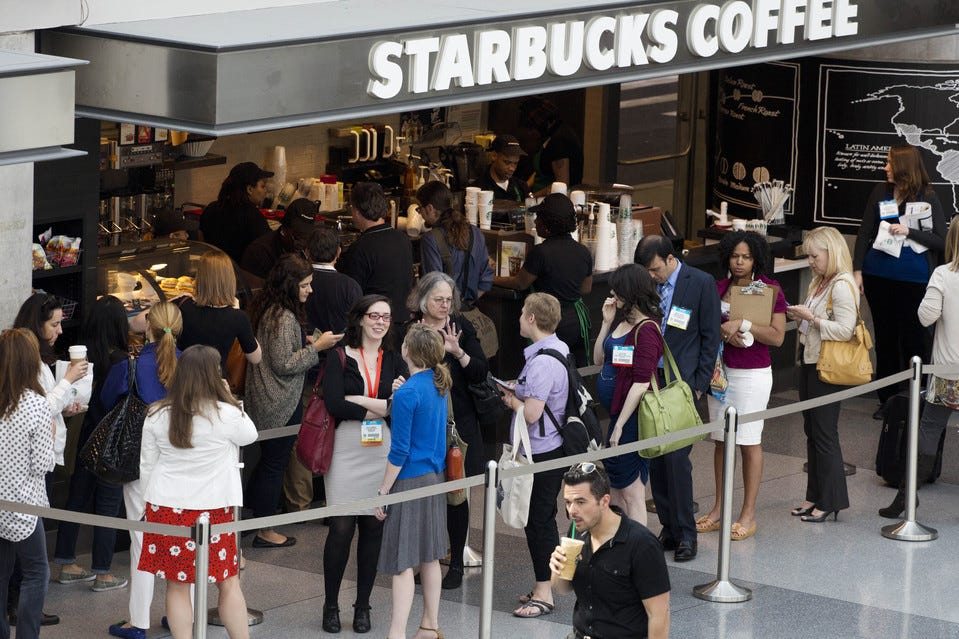
Compare this situation with Starbucks, a popular coffee chain. Almost every Starbucks has a long queue and it’s expected that you wait in a line as part of the experience. As more people arrive, the line gets longer. If you order online, there is an option to pay ahead and pick up your items at the counter.
People give up on lines because the experience is unclear, because they run out of time, or simply because they get frustrated. Which option do you think is better?
If you instinctively like short lines, you would experience:
more variability (the average time in queue is not consistent)
more line balking (it’s easy to leave the line when it’s too long and you’re at one of the ends of the lines)
paradoxically, a longer average wait time (some times are short, and the average is longer)
If you prefer a process that has a longer line, you’ll experience:
less variability (almost all lines take a similar rate to complete)
Less line balk (once you’re in line, it’s harder to leave)
Shorter average wait time (if rate is similar, then the wait time is too)
It seems strange that the longer line might deliver a better overall experience for more consumers. David Meister has a simple equation to describe the way this feels:
S=P-E
Where Satisfaction is measured by perception minus expectation. In other words, variability in lines is the most damaging thing to a process.
Little’s Law: One Way to Estimate Lines
Fortunately, there’s a simple idea that can help us estimate the capacity of a closed system. John Little proposed that the average number of items in the system is equal to the average arrival rate multiplied by the time they spend in the system.
Little’s law states:
“The long-term average number of customers in a stable system is equal to the long-term effective arrival rate multiplied by the average time a customer spends in the store.”
If Little’s law proves out, what does this mean for a process involving arrivals and departures, like a coffee or restaurant line? One observation is that you need to focus on the handoff between processes and make those as efficient as possible. If the entire system normalizes to an equilibrium (and fills up), you need to focus on other items in the process.
At Starbucks, they follow the Disney playbook and distract you while you are in the very long line, displaying merchandise and having lots of places to review and make choices. (There are even “line friends” merchandise in some markets.)
Applying Little’s Law to Product Process
Many experiences in product feel a lot like the S=P-E equation we talked about earlier. When the perception doesn’t meet expectations, customers and prospects lose their cool and quit the line.
Some of these processes that need to be examined are one-time items, like onboarding. But others happen all the time, like
JIRA Tickets (they might hide multiple embedded processes)
Queued work to be completed (until estimated, it’s hard to know how it fits in the process)
If we take the lessons of Little’s Law to heart, it’s really hard to change the overall amount of work within the system once it’s at equilibrium.
We can control:
the experience within a “line”, offering more frequent updates and clearer process to understand how items are completed or discarded
the intake to the system, offering multiple ways to handle/triage, or otherwise intake work
the places where we want to incent behavior to “jump the line”, e.g. as in the Starbucks mobile order where the customer completes most of the transaction and then gets to participate in the delivery aspect without waiting in line.
The overall system can still get out of balance. You might not notice this when you have coffee drinkers who really need their fix in the morning so they are willing to tolerate a few more minutes to get served. You will notice it when paying customers are more vocal about their needs not being served.
Returning to the question of picking between short cycle time or the shortest cycle time between long cycles, it’s not obvious which one to pick.
Shorter time cycles give you more results faster. They also give you a better opportunity for course correction when things are not meeting the expectation quotient.
But longer cycles ensure that you are following the whole process to deliver a less variable experience from end to end. Longer cycles point at higher quality, if they are connected well and provide superior observability for the current state in the process.
An opaque long process is worse than an opaque short one.
What’s the takeaway? Keep a close eye on the handoffs between systems, and the average time to complete a task. If your most important processes are highly variable, that’s a signal that you are not maximizing throughput in your system and are vulnerable to line-balking.
Links for Reading and Sharing
These are links that caught my 👀
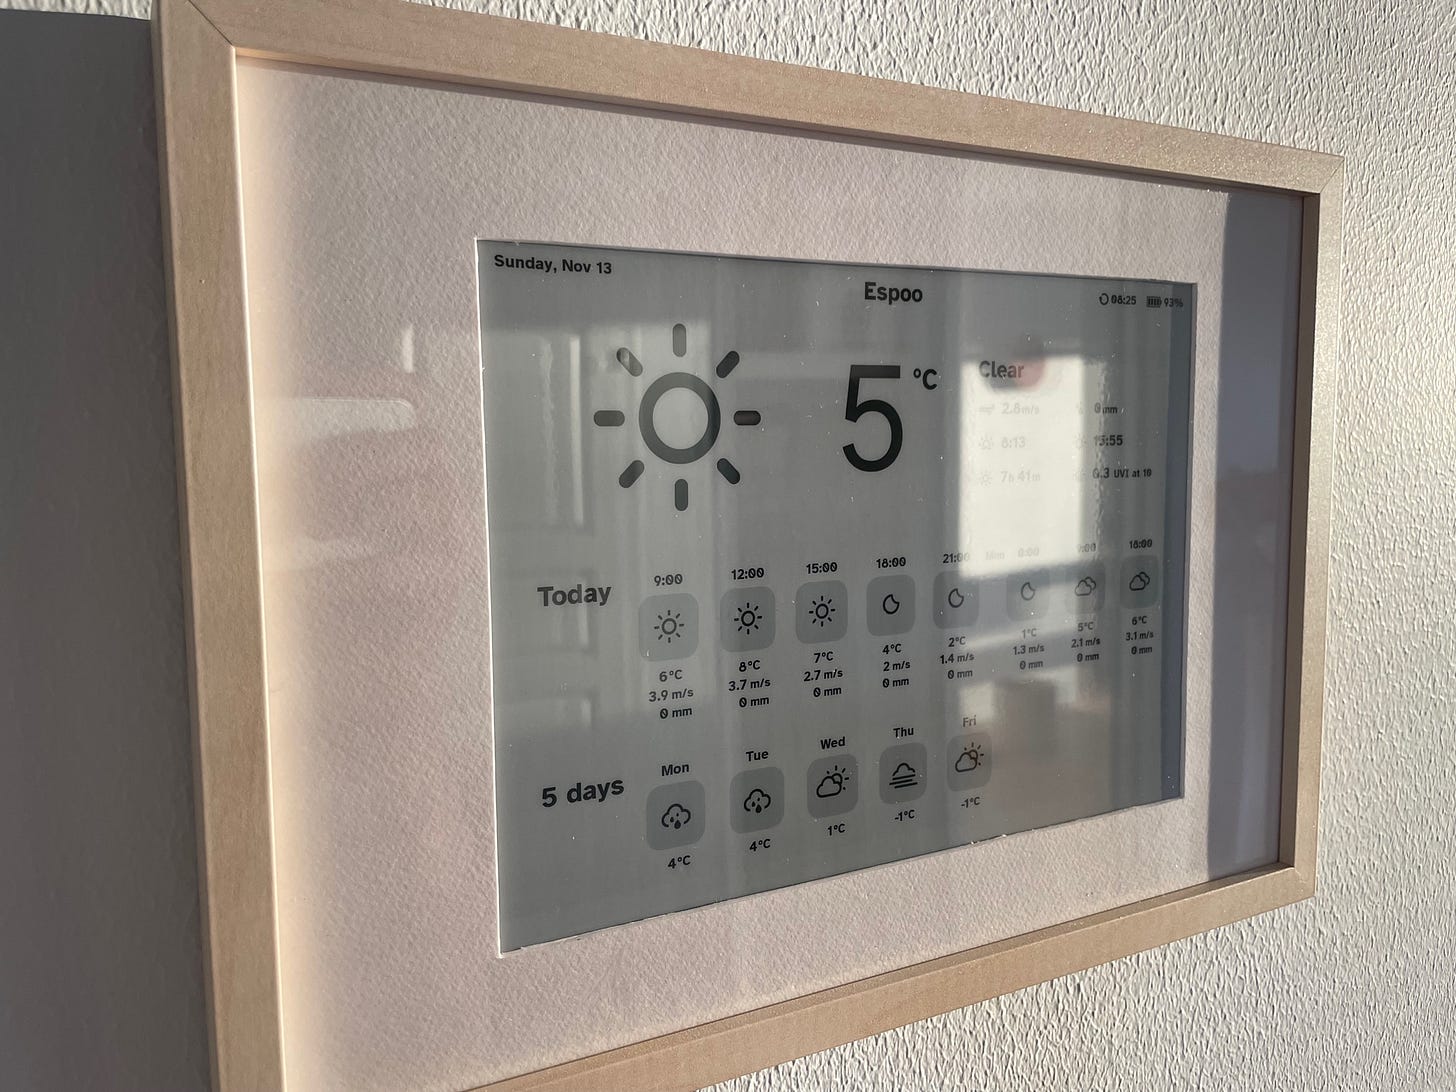
1/ Build a DIY weather station - this is a helpful tutorial on building your own e-ink based weather display. Where are more kits like this? There is a gigantic company waiting to be made by helping people take Instructables-like content, selling the parts kits for a reasonable margin, and delivering lovely electronics with a DIY aesthetic.
Builds like this are so much more interesting than buying cheap junk on Amazon or similar, and might teach you some stuff as well!
2/ Teach Machines to Edit - So far, using generative AI to make images is clunky. You need very complicated prompts and adjusting them requires quite a bit of finesse. This makes it pretty interesting that researchers are experimenting with simple prompts like “add boats on the water” to an existing image.
Making the process of editing (or instructing AI) into a conversation is a key element in bringing this technology to the mass market. When complex editing is as easy to talk to Alexa, Google, or Siri, the use of these tools will boom in unexpected ways.
3/ Reports that enforce next actions - one of the things that people often ask about a report or an analytical table: “what should I do next?” One bit of context often missing from those reports is information on the input metrics for that table. For example, when a mid-funnel dropoff in metrics occurs, was there a corresponding top of funnel drop? And was it expected (seasonal) or not?
Chad Sanderson’s article The Rise of Data Contracts proposes building metrics (and definitions) into the data architecture of the organization.
When individual metrics behave more like APIs – letting you know when they haven’t received expected information or alerting when the result is higher or lower than expected – the observability of the whole system gets better. “Looking at data lineage” becomes “ability to trace data and know what’s going on.”
What to do next
Hit reply if you’ve got links to share, data stories, or want to say hello.
Want more essays? Read on Data Operations or other writings at gregmeyer.com.
The next big thing always starts out being dismissed as a “toy.” - Chris Dixon


