

Salesforce reports are a major headache 🙈
It's hard to wrestle Salesforce reports into a useful format. When you have an analytics hammer, everything looks like a nail. Read: "Everything Starts Out Looking Like a Toy" #181

Hi, I’m Greg 👋! I write weekly product essays, including system “handshakes”, the expectations for workflow, and the jobs to be done for data. What is Data Operations? was the first post in the series.
This week’s toy: Ben Evans shares his 2024 presentation on trends. This year, it’s AI. It’s a quality overview of what we’ve learned about AI this year, and also a presentation that we’ll need to look back on to see how right it is. Edition 181 of this newsletter is here - it’s January 15th, 2024.
If you have a comment or are interested in sponsoring, hit reply.
The Big Idea
A short long-form essay about data things
⚙️ Salesforce reports are a major headache 🙈
Ask almost anyone who uses Salesforce (or administers it) how they use reports. The answer usually includes some combination of the following: “Ugh. That’s hard. We do simple reporting in SFDC and more complicated reporting elsewhere. It’s too complicated to match things up in Salesforce.”
But wait a minute. You’re talking about the supposed market leader for sales relationship management and the default choice for many companies. What do they do with reporting that makes it so hard to get what you need?
To create reports in a system like Salesforce, you create a query that filters different types of records and presents them in a table format. By grouping, filtering, and updating that information, you can create a static (point-in-time) report or a just-in-time report that updates on every load.
Simple Reports = simple outcomes
The reason most people use Salesforce to do simple things is that they track simple outcomes:
How many closed-won opportunities did we complete last quarter?
What’s the count of leads received by week for the last 3 months?
What is the average number of activities for accounts that went closed-won?
These are great “checkbox” reports that give you basic information about the data in your Salesforce instance. What they don’t do is give you deeper insight that is missed in a basic report, like bringing data from other objects or comparing information over time.
When you break it down there are 5 major reasons to compare building reports in Salesforce to a dumpster fire.
1. Reporting across more than one object is a chore

Salesforce reports are oriented to a single object. It’s the easiest way to understand the structure of the data and handles a common use case. “How many accounts do we have?” is solved by filtering distinct Account IDs.
If you want to extend that idea to another table, you can find Assets connected to accounts because the Asset table has an Account ID reference. This lets Salesforce know how to build the relevant report while including fields from both of these objects in a simple join on Account ID.
This model breaks down for more sophisticated reports. When data is held in multiple tables and linked by multiple key fields, you must select only one of those keys to build the report.
It’s possible to build a report where you find Accounts with contacts with activities, for example, but you can’t tweak the same report to give you Accounts with contacts without activities and accounts with contacts with activities in the same report easily.
To do that, you need a rollup field – an automated query to aggregate information about contacts and the number of activities they have – and to place a value on the contact object directly.
The problem with this approach? Usually, you want to define these rollup aggregations in the moment rather than adding infrastructure just to run an extra query.
Salesforce has a similar problem if you want to build custom fields in your reports based on a row-level formula (for example, if another field is not null, write the value “TRUE” or 1 to make it easier to display that report in a pivot).

This feature is four years old, and there are no improvements planned. I guess we could wait for Tableau to become the default reporting engine of Sales Cloud, but … I’m not holding my breath.
Gap: customer journey reporting is severely limited.
2. Basic chart customization is … not sophisticated
Maybe you want to do basic reporting and you’re good with a single object report.
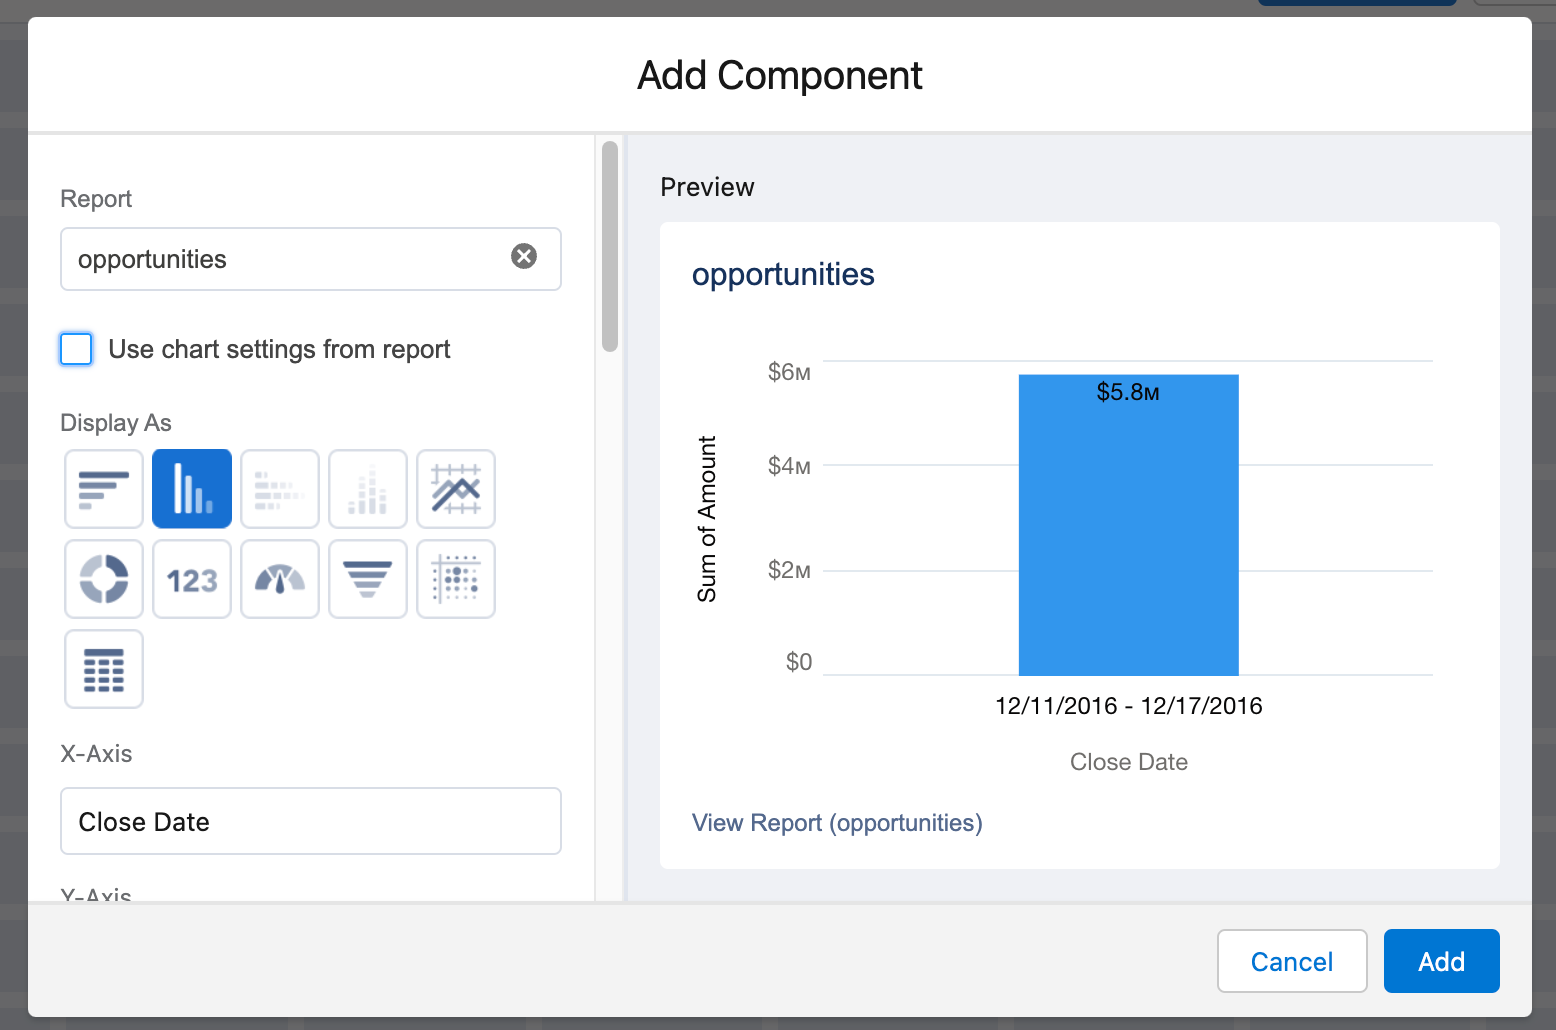
Your VP of Sales asks you, “can you put that sales won report on the home page of Salesforce so that everyone sees these results every day?”
“Great,” you say, and then wonder, “how can I add a currency prefix to the amount shown on that chart?” Go check, I’ll wait.

The answer: you can’t add a simple number format or a currency prefix to this report. This is a pretty basic form of customization and is a capability that you can access in a Salesforce Dashboard (which is not the same as the chart you will find in a Salesforce report).
Gap: report presentation customization is limited.
3. Dashboard widgets can’t be added to lightning pages
That’s ok. You’re smart. You know that you can create a more sophisticated version of this report in a Dashboard. It even has a currency indicator to show you the amount of your opportunity report that you created previously.
Cool, let’s put that dashboard (with our customized widget) on the home page for the org. Everything turned out great, except that we have a link to the dashboard widget instead of the ability to share that widget directly.

My guess is that you’re looking at two different technologies that were developed at different times, and this is basically technical debt.
Gap: you can’t put a Salesforce dashboard widget … as a component on a Salesforce lightning page. Oof.
4. It’s really easy for other people to wreck your reports
If you only have one administrator in Salesforce, you will not have a problem with people adjusting reports and saving them over the existing copies. But if you work with multiple people who have save privileges in a folder, you’re going to need to make adjustments.
Salesforce doesn’t have any version control for reports, and although it allows you to undo changes made in the current session, once there is a save by another person, it’s difficult or impossible to undo.
Gap: version control? Who needs version control?
5. Dashboard widgets are limited to 20 tiles
Dashboards in Salesforce are great, unless you want to have more than 20 pieces of information in your list. A piece of information? One of those widgets we added to our sample dashboard a bit earlier.
Want to add data-driven story tiles, extra headings, or just notes on the information presented? Want to add an image, plain text, or an embedded story? You might be out of luck.
Salesforce dashboards are stuck in the same world as reports - useful summation of reports that exist, but woefully inadequate in telling a story with data.
Gap: telling a story might require more nuance than you can provide in a widget.
What’s the takeaway? When data peeps or business users make the case to use Sigma, Google Sheets, Looker, or a myriad of other BI tools like Omni, Equals, Thoughspot, or similar, they are responding to a gap in the market created because Salesforce has stopped investing in reporting. You’d think that Tableau would become the default reporting engine in Sales Cloud, but it hasn’t happened yet.
Links for Reading and Sharing
These are links that caught my 👀
1/ A brief history of video games - This is an entertaining walk through game development, detailing the tech advances that have gotten us this far. We take a lot of things for granted these days about technology and reading this helped me understand how far we’ve traveled in a relatively short time.
2/ Source control demystified - I frequently need to look up commands to know what to do in git. This is a great no-nonsense look at git and what it’s doing behind the scenes when you commit a file.
3/ On growth rates - We often talk about “exponential growth” for a technology or a company, when what we’re talking about is quadratic growth.
What to do next
Hit reply if you’ve got links to share, data stories, or want to say hello.
Want to book a discovery call to talk about how we can work together?
The next big thing always starts out being dismissed as a “toy.” - Chris Dixon