

The secret life of spreadsheets: how you can give your apps super powers
Spreadsheets give you programming control without requiring you to be a programmer. How you can you use this to supercharge your apps? Everything Starts Out Looking Like a Toy, #124


Hi, I’m Greg 👋! I write essays on product development. Some key topics for me are system “handshakes”, the expectations for workflow, and the jobs we expect data to do. This all started when I tried to define What is Data Operations?
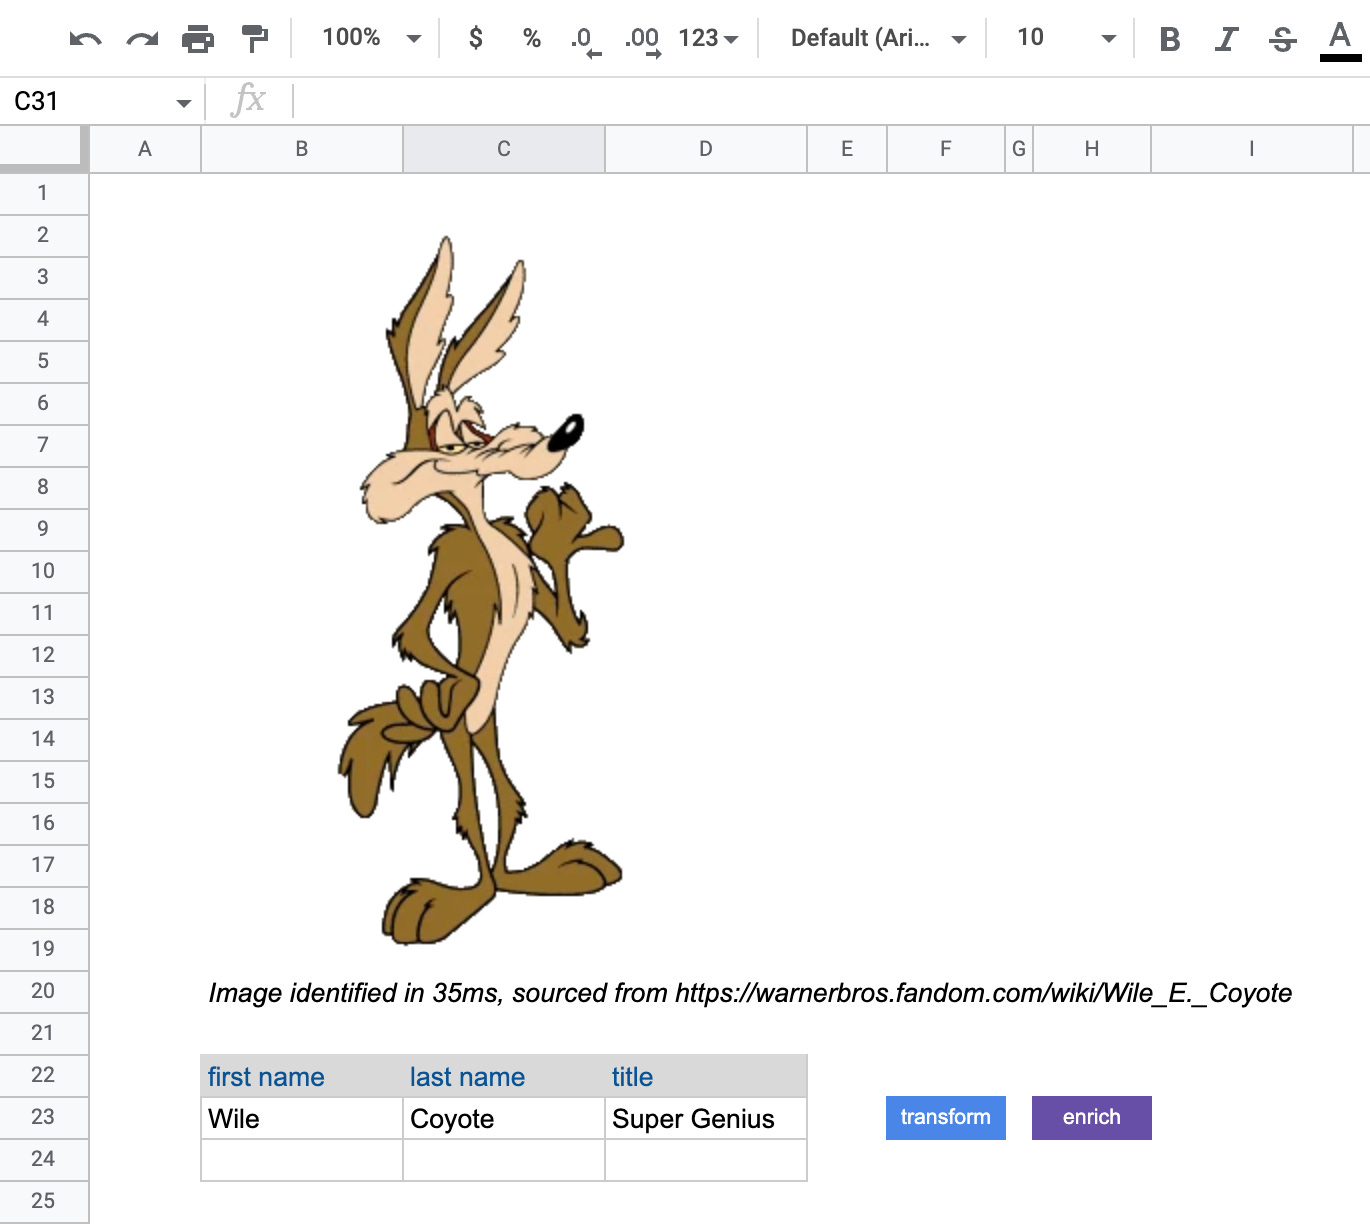
This week’s toy: a natural language tool to make Spotify playlists. Here’s an example I made for “listening to classic bebop by the fireplace.”
Edition 124 of this newsletter is here - it’s December 19, 2022.
The Big Idea
A short long-form essay about data things
⚙️ The secret life of spreadsheets: how you can give your apps super powers
As a programmer, when you need new capabilities for an app or an environment that you are building, you import those capabilities. Import is a magic spell that brings new items into your environment. (You could argue that it’s also a Pandora’s box because it also brings in potential vulnerabilities, but let’s run with it as you could easily import code-checking libraries too.)
Developer Matt Webb argues that we should add spreadsheet capabilities to existing apps and imagine new forms of apps that use Spreadsheets as the jumping off point. In Matt’s vision, there are a few ideas that become first-class concepts in an app powered by spreadsheets:
The ability to explore existing data more easily
Gaining context and going beyond the provided data
Learning and reapplying these ideas as a pattern
Exploring the existing data
How many times have you seen a table of data or a graph of that data and wanted to copy it into a spreadsheet?
Here’s a familiar example. Sellers in a Go to Market team have an impressive amount of tech at their disposal, and often prefer to use the simplicity of a spreadsheet to copy CRM data to a familiar place.
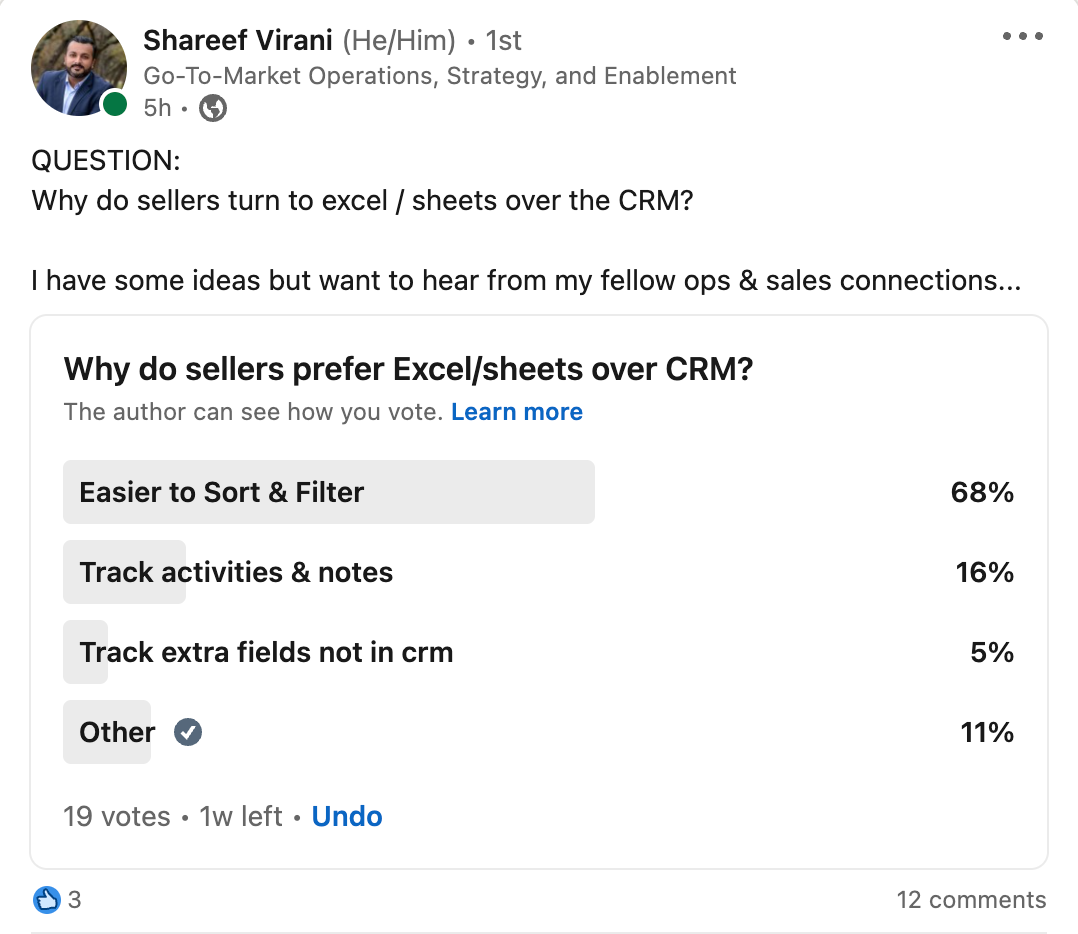
The core problem is that reporting in a CRM doesn’t feel like using a spreadsheet. By why shouldn’t it? If we get more insight from sellers who want to use pivot tables and to sort their data in a spreadsheet environment vs. forcing them to use Salesforce reports, why wouldn’t we place that same data in a spreadsheet-like environment?
One caveat here is that Excel and Sheets allow users to exfiltrate and download data from a CRM, so controlling the spread of that data is a bit more complicated than in an interface where they login and see their relevant CRM data in a tabular format. But this is a solvable problem. Why force sellers to use a flow they don’t like, when you can give them their data in a familiar place? One reason is that existing tools for spreadsheets aren’t enough like application components (outside of teams like Retool and Streamlit/Snowflake, who are really leaning into this trend).
What to add: visualization that paginates data and allows sorting, grouping, and filtering
Expanding beyond the existing data
Another common use case when you have a list of data is to enrich that data or find look-alike information based on the information that you have as a sample.
Let’s say you have a list of mid-market companies, and you want the software to give you similar information based on the industry, domain name, number of employees, and location. A helpful spreadsheet might make a structured query of Google to find patterns like competitors of … and add a company name to get a list of results to evaluate.
Combining the existing data with an intent to explore opens the spreadsheet (and the app) to answer new questions. If you think about use cases that are one step removed from the core of your application, you’ll probably uncover some things that can be prototyped with a search engine query.
What to add: the ability to call external URLs with parameters and retrieve information that can be stored
Learning to apply these ideas as a template
Tools like ChatGPT are not going to be free forever, but the strategy they use to template and organize information, return a likely result, and present it in context is an idea that is ripe for the borrowing.
How to think like a Chatbot:
Start with a template that doesn’t change very much
Identify your sources and ask them about the same question in a structured way, using data from your data set (if this doesn’t make much sense, try different queries where you combine verbs, nouns, and a stock ticket symbol, like “2022 Free Cash Flow for AAPL”)
When you get a search that works, generalize it into your process. You might not be able to learn complicated things about your data from public sources, but you can learn information that you can bucket into boolean factors and feed into simple machine learning models to get similarity scores for your information.
You won’t learn how to index hundreds of millions of documents to produce these results, but you’ll be using the same basic techniques as a chatbot.
What to add: “scratchpad” columns to a spreadsheet that are boolean evaluations based on data and can be applied to a machine model
Generalizing these ideas

Okay, there’s no need to boil the ocean.
The ideas above are riffs on what you could do if you had a first principle in your applications to make data more accessible, especially in the way that spreadsheets enable you to view, manipulate, and explore data. They might not be available options in your apps yet.
If you want to embrace spreadsheet thinking like Matt Webb suggests, what are some realistic steps you could take today? Here are a few ideas.
You could make it easier in every app to:
visualize data (imagine Highcharts or D3 as plug-in capabilities in an app - instead of building heavy-duty visualizations, you’d start with lightweight, loosely coupled prototypes)
manipulate data (think of what Hex or Jupyter are doing to create a canvas-like experience along with Python capabilities and simple code execution)
provide shorthand access to programming constructs (by making Python or similar items available, or by building no-code access to the data sourced from these languages)
If you start imagining user experiences by taking users at their word – they would rather use a familiar interface than a brand new one – what changes would that drive in your product design?
What are the implications of adding spreadsheet-like capabilities to apps?
Apps that follow this spreadsheet design language have a few things in common.
They aim for less cognitive load by using fewer metaphors to display information. For example, all visualizations in your app might have a “show table” option to reveal a grid with the contents of the data that powers the visual.
In addition, the components you use throughout the app need to behave identically to avoid confusing users. Just as in a spreadsheet where you always have sorting capabilities, use a component that ensures these will be available everywhere. There are many data grid libraries that can get you going without needing to create a custom version.
Once you’ve thought about what a consistent view looks like for data entry, manipulation, and exploration, it’s possible to think about adding specific views for specific personas that match to their view of the world.
A spreadsheet might not be the right metaphor for every user, but a data grid showing them relevant information for the current state of their application and adding an affordance to take actions sounds pretty good. Spreadsheets might just need better branding.
What’s the takeaway? It’s a lot easier to get and keep users for your application when you use a familiar user interface and actions that seem familiar without increasing cognitive load. In the case of spreadsheets, they give us some brilliant suggestions to filter, sort, explore, and learn about data.
Links for Reading and Sharing
These are links that caught my 👀
1/ Drinking your own champagne - I prefer this metaphor rather than “eating your own dog food” when talking about using your own product to improve your own operations. The team at Airtable published this great post about automating product updates. What I love about this is that they took a process that can be tedious and made it more informative and useful by adding a bit of tooling. With this process, send a digest of updates! The only caveat - you have to do a good job of bucketing your product updates.
2/ Documenting our decisions - Building the record of why we made a decision into artifacts is one of the best things we can do for future us. This site on Sustainable Architectural Decisions does an awesome job of presenting the state of a decision, what decision was made, and how we decided to move on. It has a rather unfortunate algorithm, and I hope it doesn’t make people SAD to use it.
3/ Attribution for Generative AI - One of the biggest problems with generative image creators (and pretty much anything on the market these days) is that they are trained on a model that includes copywrited works and yet do nothing to credit the original author or rightsholder when there is a derivative work. Vermillio is proposing “authenticated AI.” Check back to see whether this works - it’s an important hurdle to using AI tools in the workplace and to make money.
What to do next
Hit reply if you’ve got links to share, data stories, or want to say hello.
Want more essays? Read on Data Operations or other writings at gregmeyer.com.
The next big thing always starts out being dismissed as a “toy.” - Chris Dixon